- Your cart is empty
- Continue shopping
-
Dr Hoffman
- Posted on
- Categories:Uncategorized
- 0 comments
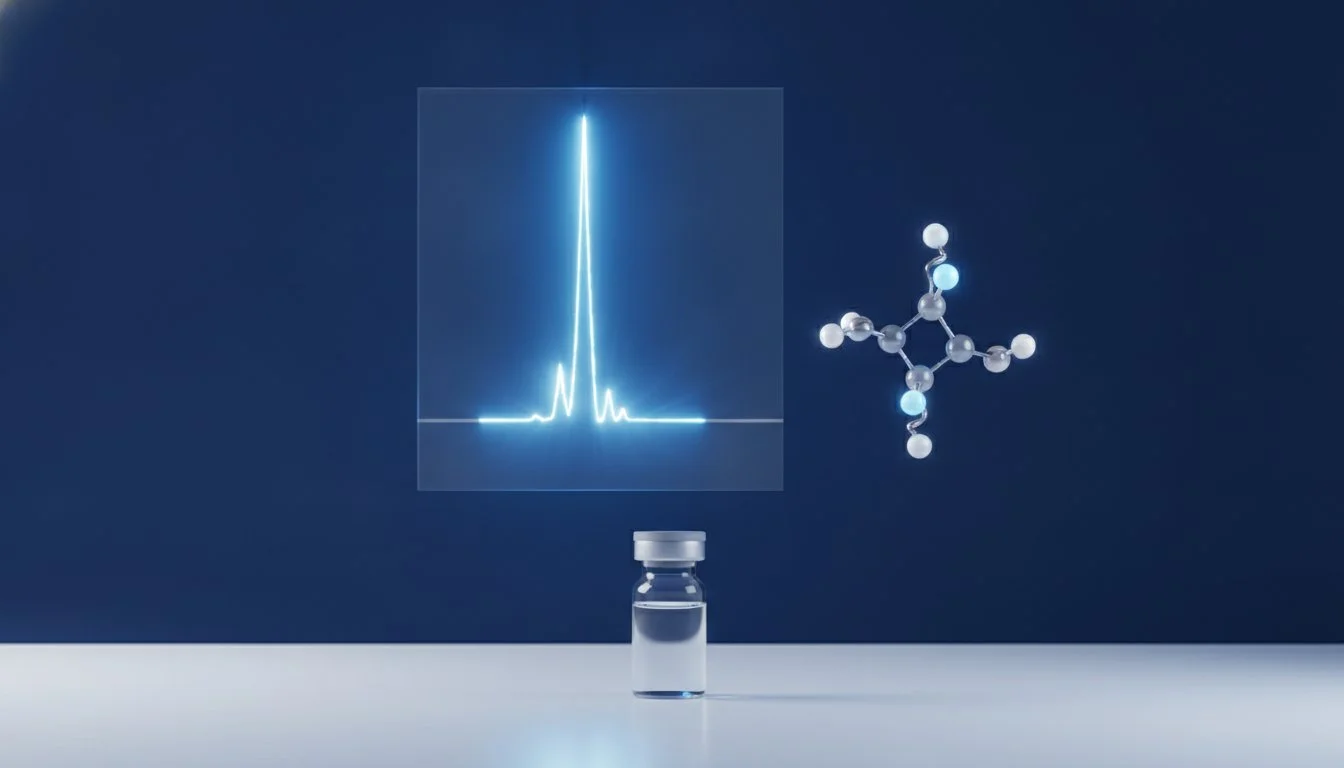
A 99% purity claim on a vial label is effectively meaningless if the supporting data reveals a cluster of secondary peaks hidden within the baseline. For researchers, the ability to scrutinize a chromatogram represents the final line of defense against compromised data and failed experiments. You likely understand that precision is the bedrock of any laboratory study, yet many professionals find themselves staring at complex graphs wondering if they’re truly seeing a pure sample or a well-masked impurity. Learning how to read hplc peptide report documentation is not just a compliance step; it’s a fundamental skill for ensuring that the chemical integrity of your reagents matches your rigorous standards.
It’s frustrating to receive a Certificate of Analysis that raises more questions than it answers, especially when the success of your project hinges on chemical exactness. We’ve designed this guide to help you master the technical nuances of HPLC chromatograms so you can verify peptide purity with absolute confidence. You’ll learn to interpret retention times, calculate area percentages, and distinguish between purity and content. This overview provides a clear framework for validating laboratory data and ensuring your research is backed by verified chemical excellence.
Key Takeaways
- Identify why High-Performance Liquid Chromatography (HPLC) remains the gold standard for verifying research-grade purity levels exceeding 99%.
- Master the technical fundamentals of how to read hplc peptide report data by correctly interpreting Retention Time and Milli-Absorbance Units on a chromatogram.
- Distinguish between purity verification and identity confirmation by understanding the essential synergy between HPLC and Mass Spectrometry reports.
- Implement a rigorous auditing checklist to cross-reference batch numbers and solvent gradients, ensuring your data integrity remains uncompromised.
- Establish a reliable verification framework that aligns with stringent laboratory standards and the requirements of professional research environments.
Understanding the Role of HPLC in Peptide Purity Verification
High-Performance Liquid Chromatography (HPLC) serves as the definitive analytical benchmark for determining the chemical purity of synthetic compounds. In a professional laboratory setting, relying on a manufacturer’s word isn’t enough. You must understand how to read hplc peptide report data to ensure your reagents meet the required specifications for your specific study. While HPLC effectively quantifies the ratio of the target peptide to its impurities, it’s vital to remember that this process measures purity rather than identity. This distinction is paramount. HPLC tells you how much of the “main substance” is present, but it doesn’t confirm that the substance is the correct sequence you ordered. Verifying these lyophilized compounds before laboratory reconstitution is a critical step in maintaining data integrity. Even minor contaminants can skew results, lead to non-reproducible outcomes, or cause catastrophic failures in sensitive assays.
To ensure total transparency, a researcher should look for two distinct data points on a Certificate of Analysis:
- HPLC (Purity): This determines the percentage of the target molecule relative to other peptide-based impurities or synthesis byproducts.
- Mass Spectrometry (Identity): This validates the molecular weight to ensure the amino acid sequence matches the theoretical mass.
The Mechanism: How HPLC Separates Peptide Molecules
The separation process relies on the dynamic interaction between a mobile phase, usually a solvent gradient of acetonitrile and water, and a stationary phase within a specialized column. Most research peptides are analyzed using reversed-phase HPLC with C18 columns. In this environment, hydrophobic interactions dictate the elution order. Molecules with higher hydrophobicity adhere more strongly to the stationary phase and elute later. This allows the system to isolate the primary peptide peak from truncated sequences or residual solvents.
Why 99% Purity Matters for Laboratory Standards
A purity level of 99% or higher isn’t just a target; it’s a requirement for high-precision cellular assays. Residual trifluoroacetic acid (TFA), often used during synthesis, can act as a significant confounder if its concentration is too high. Minor impurities can interfere with biological signaling or cause unexpected toxicity in cell cultures. At Nexa Peptide Store, we maintain an uncompromising stance on these protocols. Knowing how to read hplc peptide report findings allows you to confirm that the chemical integrity of your reagents is sufficient for your research goals.
Anatomy of an HPLC Chromatogram: Key Metrics to Identify
Deciphering the visual data is the first step in mastering how to read hplc peptide report documents. A standard chromatogram consists of a graphical plot where the X-axis represents the Retention Time (RT) measured in minutes. This metric indicates exactly when each chemical component eluted from the chromatography column. The Y-axis measures Absorbance in Milli-Absorbance Units (mAU). Most peptide analyses utilize a wavelength of 214 nm because it’s the standard for detecting the peptide bonds that link amino acids together. You should immediately look for the “Main Peak,” which represents your primary target peptide. A high-quality report displays a stable, flat baseline. Any significant drift or fluctuation in the baseline suggests poor equipment calibration or column contamination. This lack of stability can easily obscure small impurity peaks and compromise the accuracy of the purity calculation.
Retention Time (RT) and Peak Symmetry
Retention Time is the duration from the moment of injection to the point of maximum peak height. It confirms the peptide is eluting at the expected interval based on its specific hydrophobic properties. Sharp, narrow peaks are the hallmark of a high-resolution separation. If you see broad or “shouldered” peaks, it often indicates the presence of closely related impurities or suboptimal chromatography conditions. The Symmetry Factor should ideally be close to 1.0. Significant deviation from this value suggests the sample isn’t as homogeneous as the data might otherwise suggest. Researchers who require absolute precision often prefer these sharp elutions to ensure there’s no overlap with synthesis byproducts.
The Integration Table: Translating Peaks to Percentages
The integration table is where the raw visual data transforms into a quantifiable percentage. Look specifically for the “Area” and “Area %” columns. The software calculates purity by comparing the area under the main peak to the total area of all detected peaks in the run. The “Area %” for the main peak is the most critical number for verifying a supplier’s >99% purity claim. It’s the mathematical proof that the substance is as clean as the label suggests. When you’re managing complex laboratory protocols, these numbers provide the necessary reassurance that your reagents won’t introduce unwanted variables. For researchers who prioritize this level of data transparency, choosing a partner like Nexa Peptide Store ensures access to high-resolution reports for every batch. This data-backed approach is essential for maintaining the institutional credibility required in modern scientific research.

HPLC vs. Mass Spectrometry: Why You Need Both Reports
A common misconception in laboratory procurement is that a high purity percentage on an HPLC chromatogram guarantees the correct product. While HPLC is the gold standard for quantifying purity, it possesses a significant analytical blind spot: it cannot verify the chemical identity of the substance. It merely confirms that a single molecule dominates the sample. To ensure your research integrity, you must understand that learning how to read hplc peptide report data is only half of the verification process. Mass Spectrometry (MS) provides the necessary second half by acting as a molecular fingerprint. Without MS, you run the risk of utilizing a 99% pure compound that is actually the wrong peptide sequence due to a synthesis error or a mislabeled batch. Professional researchers always cross-reference the primary MS peak with the theoretical molecular weight of the peptide to ensure they’re working with the intended sequence.
Interpreting the Mass Spectrometry (MS) Report
When you examine an MS report, you’re looking for the mass-to-charge ratio (m/z) of the ions. Peptides typically appear as [M+H]+ peaks, representing the molecular weight plus one hydrogen ion, or [M+2H]2+ peaks for larger sequences that carry a double charge. If the observed mass on the report doesn’t align with the theoretical mass of your target sequence, the purity of the sample is irrelevant. You can use a peptide calculator guide to establish these baseline theoretical values for your specific sequence before you begin laboratory reconstitution. Discrepancies as small as a few Daltons can indicate missing amino acids or incomplete deprotection during the synthesis phase.
Case Study: Spotting Identity Mismatches
High HPLC purity can frequently mask synthesis failures if a researcher doesn’t scrutinize the MS data. For instance, a coupling error during the production of melanotan 2 peptide could result in a truncated sequence that elutes as a single, sharp peak on an HPLC chromatogram. To an untrained eye, this looks like a perfect sample. However, the MS report would immediately reveal a molecular weight lower than the required 1024.2 Da. At Nexa Peptide Store, we mitigate these risks by providing comprehensive third-party verification for every batch. This dual-layered approach ensures that the chemical identity and the purity levels are both validated before the compounds reach your facility. Relying on a single metric is a gamble that modern scientific standards simply don’t permit. By mastering how to read hplc peptide report findings alongside MS data, you secure the institutional credibility of your laboratory and the accuracy of your results.
Step-by-Step Guide: Auditing Your Peptide Report for Red Flags
Analytical precision is the foundation of reproducible research. Once you understand the basic metrics of a chromatogram, you must apply a rigorous auditing process to every document you receive. Relying on a summary percentage is insufficient; you must verify the underlying data to ensure laboratory integrity. Understanding how to read hplc peptide report details allows you to identify discrepancies before they compromise your study. This systematic approach ensures that the chemical reagents you utilize meet the uncompromising standards required for high-level scientific inquiry. Follow these five steps to conduct a thorough audit of your analytical data.
- Step 1: Batch Traceability. Confirm that the batch or lot number printed on the HPLC report matches the vial label exactly. Discrepancies here suggest a breakdown in logistical controls.
- Step 2: Solvent Systems. Examine the “Method” section to ensure the use of appropriate solvent gradients. Most peptide analyses require an Acetonitrile/Water system with a trifluoroacetic acid (TFA) buffer to achieve proper separation.
- Step 3: Baseline Assessment. Inspect the chromatogram for “Ghost Peaks” or excessive baseline noise. A noisy baseline often indicates poor sample preparation or contaminated equipment, which can hide minor impurities.
- Step 4: Area Percentage Validation. Ensure the Area % meets your laboratory’s specific purity threshold. While >98% is common, some sensitive assays may require >99% to prevent interference.
- Step 5: Temporal Relevance. Check the testing date. Reports should reflect recent analysis of the current lot rather than outdated data from previous years.
Common Red Flags in HPLC Reports
Abnormally wide or “tailing” peaks are a primary indicator of peptide degradation or molecular aggregation. If a peak appears broad rather than sharp, the sample may have been stored improperly or synthesized poorly. Inconsistent baselines that drift significantly during the run suggest a lack of laboratory maintenance. Additionally, be wary of reports that omit a detailed integration table. A graph without the corresponding mathematical breakdown of every detected peak lacks the transparency required for institutional verification. These omissions are often intentional attempts to obscure low-level contaminants.
Verifying Third-Party Authenticity
Independent third-party analysis provides an unbiased layer of security that in-house testing cannot replicate. High-functioning operations utilize external laboratories to validate their manufacturing results. You should look for report IDs or QR codes that allow you to verify the data directly with the originating facility. This level of transparency is a core signature of established providers like Nexa Peptide Store. For researchers who demand absolute data integrity, you can order verified laboratory compounds that include complete, third-party analytical reports for every batch. This ensures that your results are backed by objective, verifiable evidence rather than manufacturer claims alone.
Research Integrity and Quality Assurance at Nexa Peptide Store
Nexa Peptide Store maintains a foundational commitment to transparency and clinical-grade precision. We provide comprehensive HPLC and Mass Spectrometry data for every batch we distribute. This isn’t a secondary service; it’s a core component of our quality assurance protocol. Our “Research Use Only” policy dictates an uncompromising approach to chemical verification because we recognize that laboratory data integrity depends entirely on the purity of the reagents. While some suppliers might provide generic reports, we ensure that every investigator understands how to read hplc peptide report documentation specific to their unique lot. To preserve the high purity levels captured in these reports, all compounds undergo a professional lyophilization process. This vacuum-drying technique removes moisture while maintaining the structural integrity of the peptide, allowing for long-term stability during transit and storage. Institutional procurement teams can request batch-specific Certificates of Analysis (COAs) to satisfy internal compliance requirements and ensure every study begins with verified materials.
Our Testing Protocols for High-Purity Compounds
Our testing protocols are designed to meet the rigorous demands of academic and clinical research. We employ an iterative verification process that begins at the raw synthesis stage and continues through to the final vialing. This is particularly critical for high-demand research subjects such as tirzepatide, where molecular complexity requires multiple rounds of chromatography to ensure the absence of truncated sequences. We support university and institutional research standards by adhering to standardized testing methodologies that prioritize accuracy over throughput. By maintaining these protocols, we provide a level of commercial reliability that mirrors the precision of the laboratories we serve. Every vial is a reflection of our disciplined approach to manufacturing and quality control.
Securing Reliable Research Materials
Securing reliable materials is the final step in a researcher’s due diligence. While the synthesis process is complex, the final verification always lies in the raw data. Mastering how to read hplc peptide report findings empowers you to act as a technical gatekeeper for your project. We encourage investigators to prioritize suppliers who offer total transparency in their data practices and provide batch-specific evidence for every claim. This commitment to evidence-based supply chains protects your research from the risks associated with sub-standard chemical purity or identity mismatches. When you choose a partner that values data as much as you do, you secure the future of your findings. You can browse our catalog of 99%+ pure research peptides to find compounds that meet these strict analytical requirements and institutional standards.
Advancing Laboratory Standards through Data-Backed Verification
Mastering the analytical intricacies of documentation is a prerequisite for maintaining the highest levels of research integrity. By understanding how to read hplc peptide report data, investigators can confidently distinguish between a truly pure compound and a sample compromised by synthesis byproducts or baseline noise. The synergy between HPLC purity metrics and Mass Spectrometry identity confirmation remains the definitive framework for validating chemical reagents. This rigorous auditing process ensures that every variable in your study is controlled and every result is reproducible. As the industry moves toward stricter compliance and formal approval pathways, prioritizing suppliers who offer transparent, batch-specific data is essential for institutional credibility.
Nexa Peptide Store remains a dedicated partner to global research institutions, providing compounds tested to 99%+ purity with comprehensive documentation. Our disciplined approach to manufacturing ensures that you receive the precise sequences required for your protocols. Access High-Purity Peptides for Your Laboratory Research and secure the foundational integrity of your next project. We look forward to supporting your scientific advancements with verified chemical excellence.
Frequently Asked Questions
What is a good purity percentage for a research peptide?
A purity level of at least 98% is generally required for standard cell culture and animal studies, while 99% or higher remains the industry gold standard for high-precision research. Peptides with 95% purity often contain significant concentrations of truncated sequences or residual synthesis chemicals. These contaminants can introduce unwanted variables into biological assays. Institutional researchers should prioritize the highest available purity to ensure that experimental outcomes are truly representative of the target compound’s activity.
Does a single peak on an HPLC report mean the peptide is 100% pure?
A single peak doesn’t guarantee 100% purity because certain impurities might elute at the same time as the main substance or fail to absorb UV light. When learning how to read hplc peptide report data, you must recognize that “co-eluting” impurities can hide directly beneath the primary peak. This is why professional laboratories often utilize Mass Spectrometry or multi-wavelength analysis. These secondary verification methods ensure that the sample is homogeneous and free of masked contaminants.
What is the difference between HPLC purity and peptide content?
HPLC purity reflects the ratio of the target peptide to other peptide-based impurities, while peptide content refers to the actual weight of the peptide relative to non-peptidic components like water and salts. It’s common for a vial to possess 99% HPLC purity but only 80% peptide content. This occurs because the lyophilized powder contains counter-ions from the purification process. Understanding this distinction is vital for accurate molar calculations during laboratory reconstitution and dosing.
Can I use an HPLC report from six months ago?
An HPLC report from six months ago remains valid as long as it corresponds to your specific lot number and the material was stored under optimal environmental conditions. Peptides are chemically stable when maintained in a lyophilized state at temperatures of -20°C or -80°C. However, degradation can occur if the vial was exposed to moisture or thermal fluctuations. Always verify that the report’s batch ID matches your vial to ensure the data accurately reflects your current lot.
What does “Retention Time” tell me about my peptide?
Retention Time (RT) is a specific measurement of how long a peptide remains within the chromatography column based on its unique hydrophobic properties. While RT isn’t a definitive identification tool on its own, it serves as a highly consistent marker for known sequences under standardized conditions. If the RT on your report deviates significantly from established benchmarks, it may indicate an incorrect amino acid sequence or the presence of an alternative salt form that could alter experimental results.
Why do some HPLC reports show multiple small peaks at the beginning?
Multiple small peaks appearing very early in the chromatogram are typically indicative of residual solvents, salts, or very small fragments eluting near the void volume. These components are often non-peptidic and are frequently excluded from the final purity calculation in a standard report. While their presence doesn’t necessarily compromise the peptide’s chemical integrity, significant early-elution noise can suggest suboptimal purification or residual processing chemicals that researchers should account for in sensitive studies.
